PyGraphistryでグラフを分析
PyGraphistry Implementation Workflow for Interactive Graph Intelligence Pipelines in Security Analytics and Risk Investigation
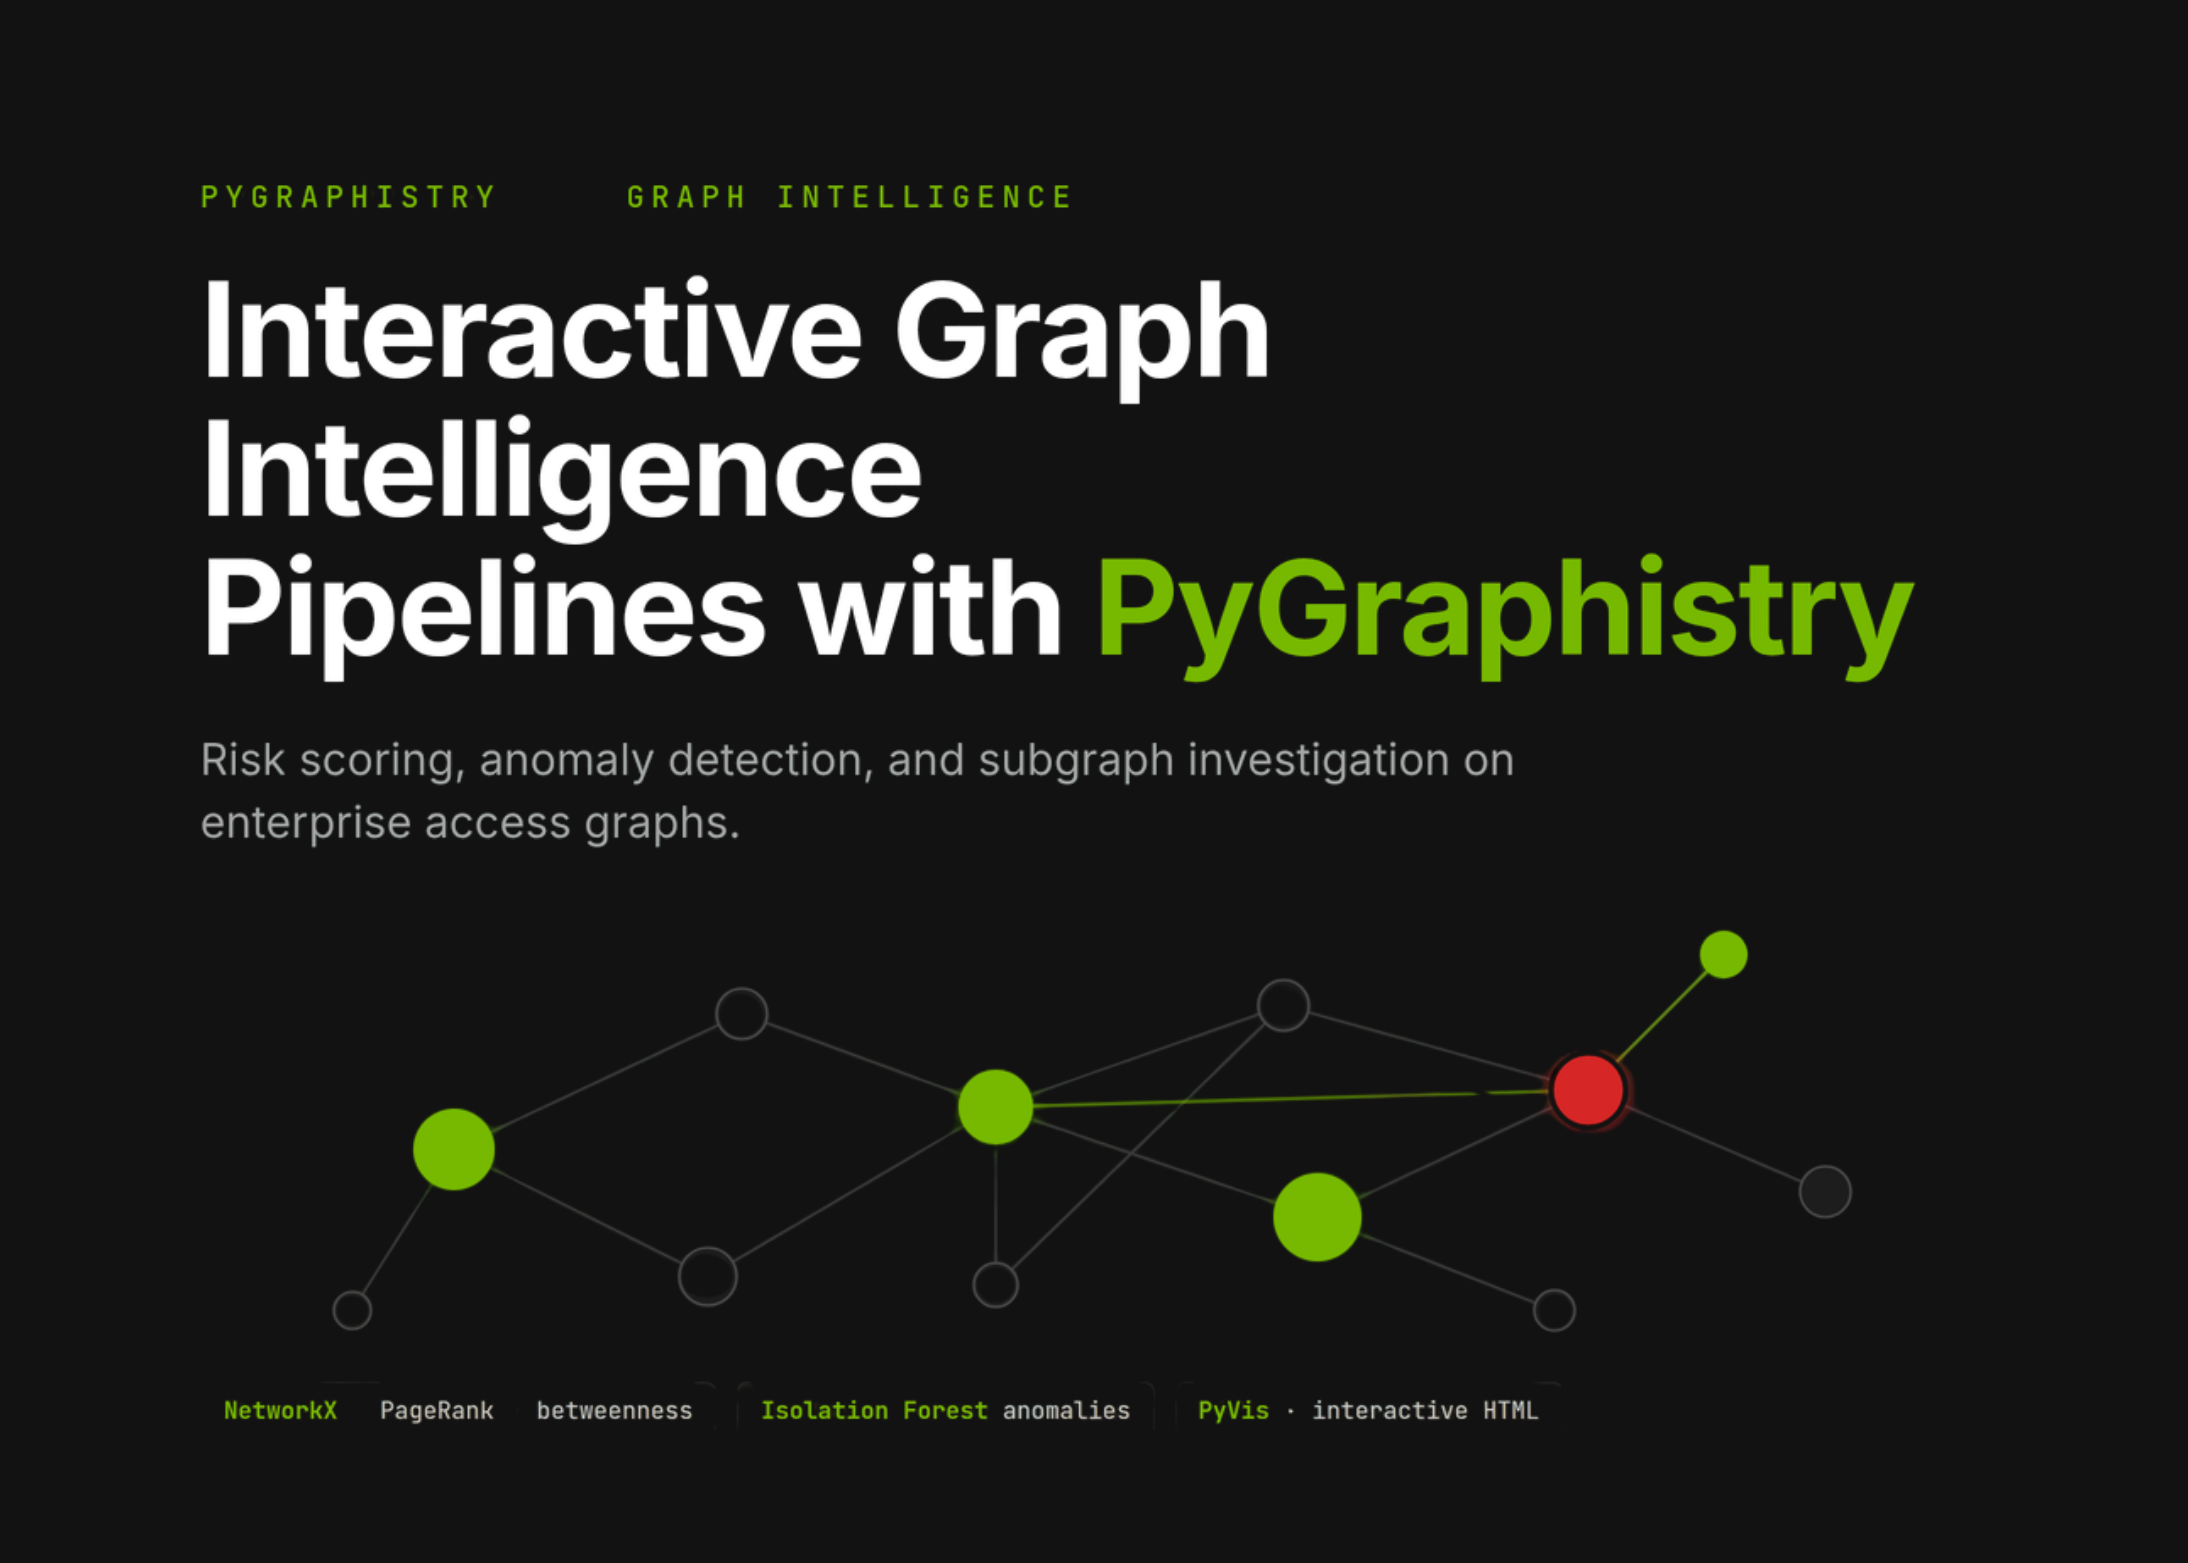
PyGraphistryを使ったセキュリティ分析の高度な手順が公開。企業内の不審な行動や危険な機器をAIが素早く見つけ出すのに役立ちます。
このチュートリアルでは、インタラクティブなグラフ分析と可視化のために、PyGraphistryを中心とした高度なColab対応ワークフローを構築します。まず、現実的な企業スタイルのアクセスデータセットを作成し、それをノードとエッジに変換し、リスクスコア、異常インジケーター、中心性指標、コミュニティ検出、レイアウト埋め込みでグラフを強化します。次に、PyGraphistryを使用して、グラフ構造、視覚的エンコーディング、ラベル、ツールチップ、フィルターされたサブグラフを結合し、Graphistryの認証情報が設定されていない場合にローカルなインタラクティブ可視化を生成します。この実装を通じて、グラフインテリジェンスが、実用的なセキュリティ分析の現場で、不審なユーザー、危険なデバイス、IP関係、機密サービス、高リスクの行動パターンを調査するのにどのように役立つかを確認します。将来のコードノートブックと実装については、GitHubで私たちにスターを付けてください。 導入 PyGraphistryと依存関係のインストール コードをコピー 別のブラウザを使用 import os, sys, subprocess, warnings, textwrap, json, math, random warnings.filterwarnings("ignore") def pip_install(packages): subprocess.run([sys.executable, "-m", "pip", "install", "-q", "-U", *packages], check=True) pip_install([ "graphistry[networkx,umap-learn]", "pandas", "numpy", "networkx", "scikit-learn", "pyvis", "matplotlib", "pyarrow" ]) import numpy as np import pandas as pd import networkx as nx import matplotlib.pyplot as plt import graphistry from pathlib import Path from IPython.display import display, HTML, IFrame from sklearn.preprocessing import StandardScaler from sklearn.ensemble import IsolationForest from sklearn.decomposition import PCA from pyvis.network import Network OUT_DIR = Path("/content/pygraphistry_advanced_tutorial") OUT_DIR.mkdir(parents=True, exist_ok=True) SEED = 42 rng = np.random.default_rng(SEED) random.seed(SEED) print("=" * 100) print("PyGraphistry Advanced Colab Tutorial") print("=" * 100) print("This tutorial builds an enterprise-style access graph, computes graph analytics,") print("creates suspic"
この記事について質問
記事の内容に答えます。記事外のことは都度ウェブで調べます。